Applying a performance profile to a stub
After you create a performance profile, you must apply recorded response data to the stub execution to gather performance data.
Procedure
- In Test Factory, open a stub.
- Specify a response-time type for each operation. On the Properties tab, double-click the cell under Type.
- In the Edit window, select Performance Profile. The performance
profile options are displayed.
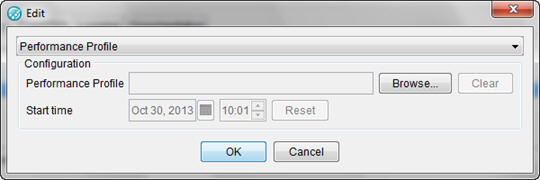
- Select a performance profile.
- Select a start time. The start time represents the simulated
time at which the first phase begins. The start time setting is used
in conjunction with the start time that is configured in the response
time properties of a stub, to determine at what point in the profile
to begin when a stub is started. Use the start times to simulate the
response times for a specific period in time, regardless of the actual
time the stub executes. The selected time should fall within the period
recorded in the performance profile, as defined by the profile's start
time and the total duration of all of its phases.Here is an example of how to use the start time:Assume that the performance profile covers 124 hours starting from November 11, 08:00, and time from November 11, 08:00 to November 16, 12:00. Assume that the first few phases are as follows (duration (minutes), fixed delay (ms)):
- 60, 1000
- 60, 2000
- 60, 3000
- 30, 4000
- 30, 5000
- 720, 6000
- 480, 500
- 60, 1000
- When the stub runs, as each phase starts, the changes to the response time are displayed on the console or written to the agent log.