Creating a stub that includes a performance profile
You can save performance data at the same time that you save recorded events for a stub in Recording Studio.
Procedure
- In Recording Studio, record a set of events and select the ones to save.
-
Click the Save Events icon (
 ).
For more information, see Stub creation by using the Recording Studio.
).
For more information, see Stub creation by using the Recording Studio. -
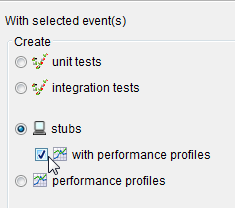
On the Resource Type page of the Recorded Events wizard, click
stubs and then select with performance profiles.
-
Complete the steps in the wizard as you normally would.
Make sure that your transactions are grouped properly. For example, pair requests with matching replies.The wizard extracts the timing data from the recorded events to automatically populate the performance profile.
Results
What to do next
- You can edit a performance profile by double-clicking the name. For more information about the contents of this file, see Populating performance profiles manually.
- You can assign this performance profile to a different stub. For more information, see Applying a performance profile to a stub.