Importing performance data from Recording Studio
When you save events in Recording Studio, you can import performance data into a performance profile. You can then use the performance profile to simulate the timing of the responses from a stub.
Procedure
- In Recording Studio, record a set of events and select the ones to save.
- Click the Save Events button. On
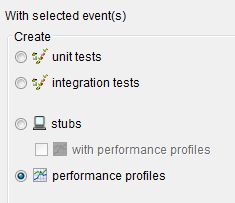
the Resource Type page of the Recorded Events
wizard, click performance profiles.
Alternatively, click the Create a Performance Profile from selected events icon (
 ), or right-click any
of the selected events and click Create Performance Profile.
), or right-click any
of the selected events and click Create Performance Profile.For more information about saving events, see Stub creation by using the Recording Studio.
- Complete the steps in the wizard as you normally would. Make sure that your transactions are grouped properly. For example, pair requests with matching replies. Specify a name for the performance profile on the Summary page.
Results
What to do next
- You can edit a performance profile by double-clicking the name. For more information about the contents of this file, see Populating performance profiles manually.
- The performance profile is useful only when you assign it to one or more stubs. For more information, see Applying a performance profile to a stub.