Populating performance profiles manually
You can populate performance profiles for stubs manually.
Procedure
- In Test Factory, right click a stub and then click .
- Enter a name for the performance profile and click OK. The Performance Profile pane opens.
-
To edit the start time, click the calendar icon next to Profile start time. The default is the date and time that the profile is created.
The profile start time represents the simulated time at which the first phase begins. The start time setting is used in conjunction with the start time that is configured in the response time properties of a stub, to determine at what point in the profile to begin running when a stub is started. By specifying a start time, you can simulate the response times for a specific period in time, regardless of the actual time the stub executes.
- To change the phase duration time units, select Hours, Minutes, or Seconds from the list. The default is Minutes.
-
To set the response time distribution, select Fixed, Uniform, or Gaussian. The default is Fixed.
Note: If you select Uniform or Gaussian, you must define a minimum delay and a maximum delay, in milliseconds, for each phase.
-
To create a phase, click the Plus sign icon (+). A row is displayed with cells where you can enter values for each setting. As you add phases and data, a graph that represents the performance profile displays:
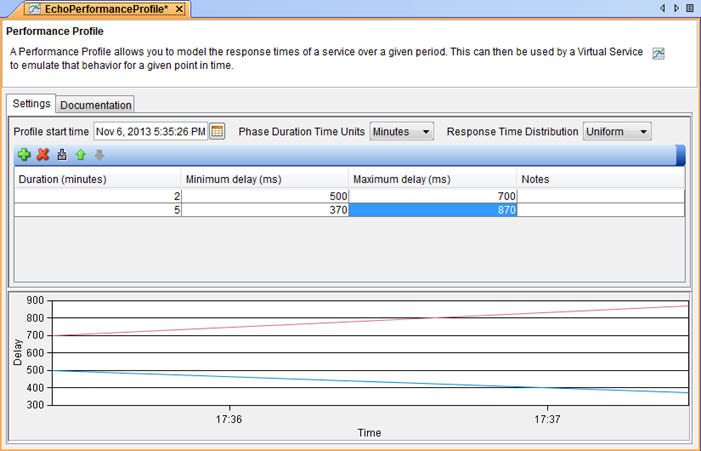 To alter displayed values, you can either change the values in the table, or drag data points in the graph vertically. If you drag the data points in the graph, the values in the table change to reflect the new data points.
 - To change the order of phases, select a row and then use the up and down arrows at the top of the Settings tab. To delete a phase, select the row and click the Delete (X) icon.