Configuring the Windows™ Performance Monitor probe
The Windows™ Performance Monitor probe runs on a host computer that can be configured in the Architecture School Physical View.
About this task
To configure the default probe or add another:
Procedure
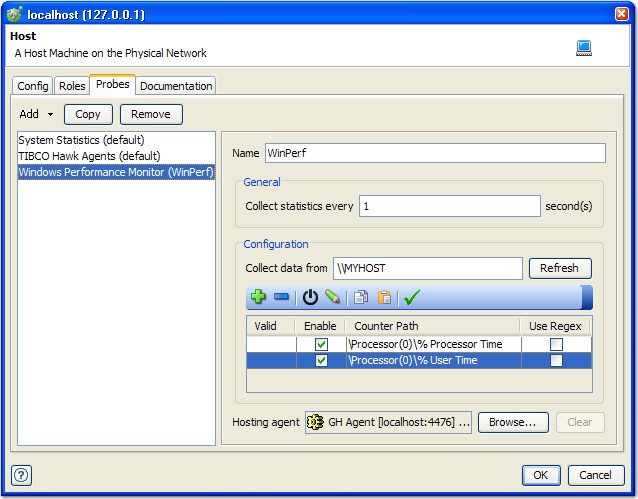
- Edit the host that you want and click the Probes tab.
- Next, you can choose from one of the following
actions:
- To add a new probe, click .
- To copy an existing probe, select the probe and click Copy.
- To delete a probe, select the probe and click Remove.
- To configure an existing probe, select it and modify its settings in the configuration panel on the right.
- Enter a name for the selected probe in the Name field.
- Set the interval (in seconds) at which statistics can be collected in the Collect statistics every ... field.
- The Configuration panel
is used to specify the target host and the counters to monitor. In
the Collect data from field, which is "tag-aware", enter the
hostname of the computer from which statistics are to be collected.
Note: If the Collect data from field is left blank, the local computer name is used.
Counters are configured by using the toolbar above the counter table, as follows:
Icon Description 
Add one or more counters to the table (see Adding counters). 
Remove the selected counters from the table. 
Toggles the Enable state of any selected counters. 
Opens the Edit Counter Path dialog for modifying the individual segments of the counter path (see Editing counters). 
Copies the path of one or more selected counters. The copied paths can be pasted into a text editor to get a new-line-separated list of counter paths (without the computer name prefix), or into another probe configuration on the same host or a different host. You can also copy a path by pressing CTRL+C. 
Pastes a previously copied set of counter paths into the counter table. You can also paste by pressing CTRL+V . Note: A row in the counter table must be selected before pasting.
Validates the currently selected rows by using the computer name in the Collect data from field and the path of the selected row. If a tag is defined for the host or any of the path entries, the Tag Values dialog is displayed, prompting the user to inset values. Valid entries are marked with a green check mark under the Valid column, and invalid entries are marked with a red "x". If the Use Regex option is enabled for a row, the instance (that is, the string within the "()" characters) are used as a regex pattern. If at least one instance literal matches the regex pattern, the pattern is considered valid.
Note: At run time, all instances that match the regex pattern are recorded.Note: The data in the counter table can be sorted by using any column by clicking the column name. You can change the sort order by clicking a second time on the same column title. - To select or change the agent to host the selected probe, click Browse next to the Hosting agent field and select the agent you want from the project resource tree.
- To clear the current selection, click Clear.