Lesson 8: Create the calculation history handler
Create a table in which you can click a row to display a previous calculation.
About this task
In this lesson, you use the DataGrid widget to create a table. The DataGrid widget has advanced capabilities for interaction and visual presentation that make it preferable to the GridLayout widget for displaying an array of records.
In lesson 4, you dragged a record variable onto the editor to create a GridLayout widget. In this lesson, you drag an array of records onto the editor, which by default creates a DataGrid widget.
Create the handler
Procedure
- In the handlers package, create
a Rich UI handler named CalculationHistoryHandler.The Handler opens in the Design view of the Rich UI editor.
- Delete the default GridLayout widget.
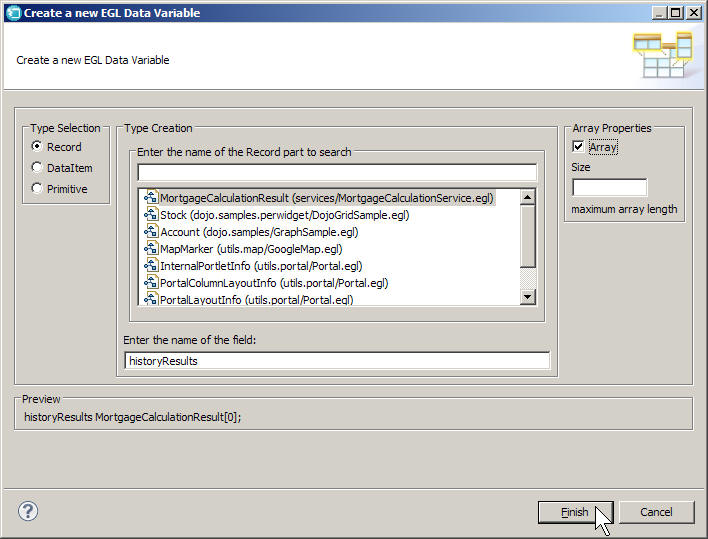
- Create a variable to hold an array of MortgageCalculationResult
records.
- Right-click the background of EGL Data view, and then click New > EGL Variable.
- In the Create a new EGL Data Variable wizard, in the Type Creation section, select the MortgageCalculationResult record, as you did in Lesson 4.
- For Enter the name of the field,
enter the following name:
historyResults - Under Array Properties, select
the Array check box. Do not specify a size.

- Click Finish.
- Drag the new variable to the Display surface in the Rich
UI editor.EGL displays the Insert Data wizard. This wizard is the same wizard that you saw in Lesson 4, though with different defaults because the variable that you dragged onto the editor is a dynamic array.
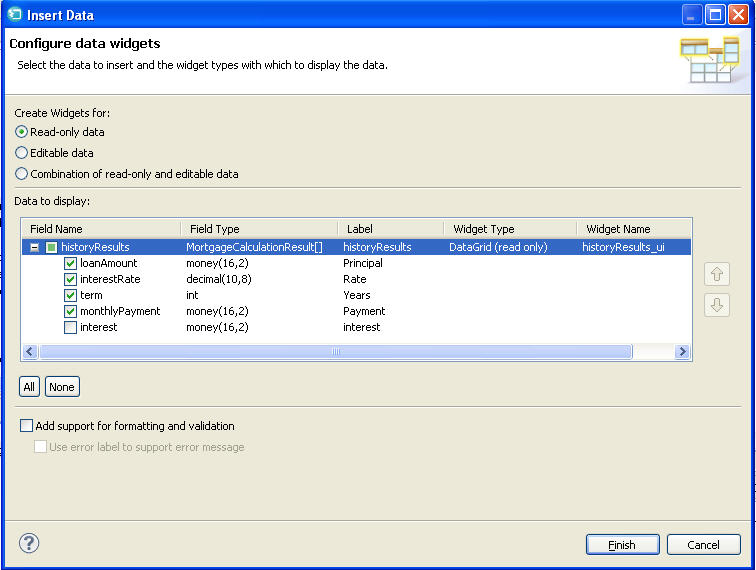
- Make the following changes in the Insert Data wizard:
- Under Create Widgets for, leave the default value of Read-only data.
- Clear the check box for the interest field.
- Change the labels for the remaining fields as follows:
- Change loanAmount to Principal.
- Change interestRate to Rate.
- Change term to Years.
- Change monthlyPayment to Payment.
- Clear the Add support for formatting and
validation check box.The completed wizard looks like the following image:

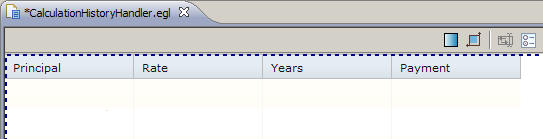
- Click Finish. The web page looks
as follows.

You will code the remainder of the calculation history handler in Source view. - At the bottom of the editor, click the Source tab.
- In the declaration for the historyResults_ui DataGrid widget,
add the following content before the columns property:
The specified value ensures that the user can select only one row of the grid rather than multiple rows.selectionMode = DataGridLib.SINGLE_SELECTION, - On the line after you set
selectionMode, type the following code:selectionListeners ::= cellClicked,You just updated a listener property, which takes an array of functions that run in array-element order. In particular, you appended a function to the array of functions associated with the
selectionListenersproperty. You will code the new function later in this lesson.The listener functions run in response to a user action, such as a click or, in some cases, in response to a function call that selects or deselects a row or that updates a check box.
- Change the default widths of the columns so they will fit
in the smaller portlet window:
- Set the width of the Principal column to 80.
- Set the width of the Rate column to 80.
- Set the width of the Years column to 50.
- Set the width of the Payment column to 70.
- After each of the width values you just specified, in the
same set-values block (the area with the curly brackets), set an alignment property
to right-align the numbers in each column:
For example, the declaration for the Principal column now looks like the following code:, alignment = DataGridLib.ALIGN_RIGHTnew DataGridColumn {name = "loanAmount", displayName = "Principal", width = 80, alignment = DataGridLib.ALIGN_RIGHT}, - Add the formatter property to
three of the column declarations, as follows:
- For the Principal column, reference the custom
formatDollarsfunction, which you will write later in this lesson:
The entire declaration now looks like the following code:, formatters = [ formatDollars ]new DataGridColumn {name = "loanAmount", displayName = "Principal", width = 80, alignment = DataGridLib.ALIGN_RIGHT, formatters = [ formatDollars ]}, - Add the following code for the Rate column:
, formatters = [ DataGridFormatters.percentage ] - You do not need special formatting for the Years column.
- Add the following code for the Payment column:
The code now has the following content:, formatters = [ formatDollars ]
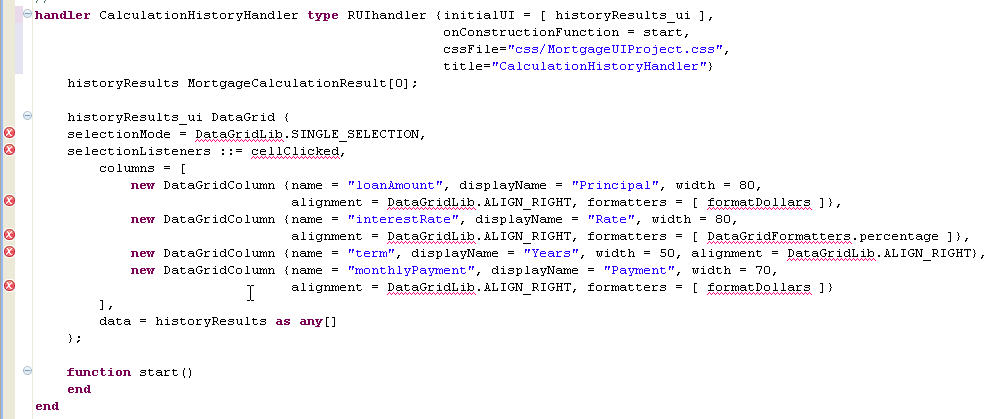
In general, the formatters property takes an array of function names. The functions can be predefined, or you can write custom functions. For example, the
percentagefunction is provided in the DataGridFormatters library that is included in the com.ibm.egl.rui.widgets project.
- For the Principal column, reference the custom
- Add the following code to the
startfunction:
As before, you use the InfoBus to invoke a function when the service returns a new calculation.InfoBus.subscribe("mortgageApplication.mortgageCalculated", addResultRecord); - Add the
addResultRecordfunction after thestart()function:
Here, you cast an incoming value to a MortgageCalculationResult record. You then append the new results to array of results and update the data property. That update causes the widget to refresh.// Update the grid to include the latest mortgage calculation function addResultRecord(eventName STRING in, dataObject ANY in) resultRecord MortgageCalculationResult = dataObject as MortgageCalculationResult; historyResults.appendElement(resultRecord); historyResults_ui.data = historyResults as ANY[]; end - Add the following listener function:
The function retrieves the data-grid row selected by the user and provides that row to the Infobus. The Infobus in turn invokes a function in any handler that has subscribed to the event named “mortgageApplication.mortgageResultSelected.”// Publish an event to the InfoBus whenever the user selects an old calculation function cellClicked(myGrid DataGrid in) updateRec MortgageCalculationResult = myGrid.getSelection()[1] as MortgageCalculationResult; InfoBus.publish("mortgageApplication.mortgageResultSelected", updateRec); end - Add the following function to format monetary amounts:
The value of the second parameter is available to the EGL runtime code because the parameter modifier is InOut by default.function formatDollars(class string, value string, rowData any in) value = mortgageLib.formatMoney(value); endNote that you are reusing the
formatMoneyfunction from the mortgageLib library. - Reformat the file by pressing Ctrl+Shift+F. Then, remove the error marks by pressing Ctrl+Shift+O, and save the file. If you see errors in your source file, compare your code to the file contents in Finished code for CalculationHistoryHandler.egl after Lesson 8.
- Close the file.
Results
Lesson checkpoint
About this task
- Drag and drop an array of records to create a data grid.
- Trigger an event when a cell of the data grid is clicked.
- Format columns in the data grid.
In the next lesson, you integrate this handler with the rest of the application.