Selecting axes
If some of the plotted counters have widely varying values (for example, the pass rate is in the tens range, but the duration is in the thousands), you may want to display one or more counters on its own axis.
About this task
Otherwise, the large range of numbers on the Y-axis will cause the smaller counters to lose their detail as they are plotted along the origin.
To plot the selected counter on an additional axis:
Procedure
- Use the Axis list to select the axis.
- You can select one more axis than the number
that are currently displayed. That is, if one axis is displayed, you
can select 1 or 2. If two axes are displayed,
you can select 1, 2, or 3.
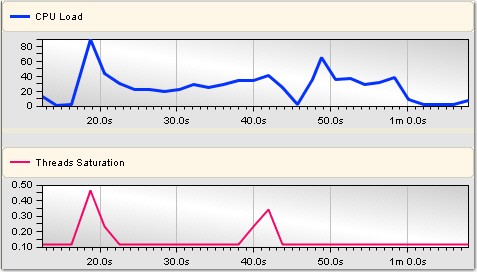
The following example shows two counters displayed on two axes: