Configuring styles used for plotting counters
This topic explains how to configure styles used for plotting counters.
About this task
The styles used to plot each counter can be configured by:
Procedure
- Double-clicking the counter’s colored bar
in the tree on the Counters tab.
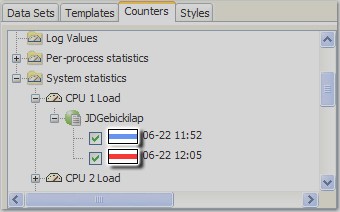
- After double-clicking the counter’s plot
line, the Choose Style dialog is displayed.
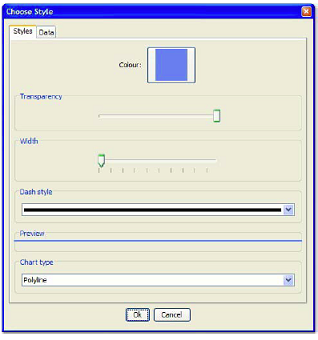
On the Styles tab of the Choose Style dialog, all aspects of the line and chart style for the selected counter can be modified, as follows:
- Color changes the current line color using the Choose stroke color dialog. After selecting the new color, click OK to apply it.
- Transparency affects the strength of the plot lines color and whether or not other plot lines will show through the current line. As you vary the transparency, the color and line preview will reflect the change.
- Width changes the width or thickness of the selected plot line.
- Dash style enables you to select a solid or dashed line for the selected plot.
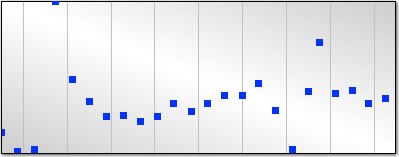
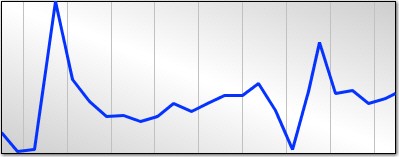
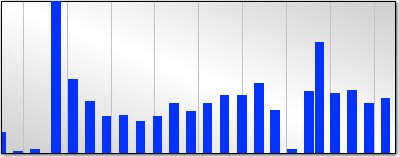
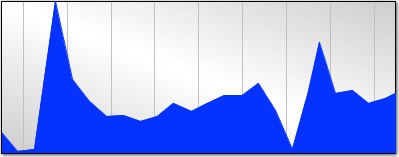
- Chart type enables you to select from five
different chart styles, as follows:
Polyline
Stacked Polyline
Bar
Area
Scatter