Logging measurements to the results database
You might want to periodically record custom data in to a database as a performance test runs.
About this task
- Sample custom data over a time period (optional)
- Add data values to record
- Add attributes to identify the recorded data
- Use a custom time stamp with the recorded data (optional)
After you set up logging measurements, you might want to change limits for counters and attributes as covered in these tasks.
Sampling custom data over a time period (optional)
With sampling, summary data is recorded at the end of each summary period. Without sampling, all the data that is received is recorded. Under Counters on the Log Measurement dialog, you can specify whether you require sampling or not. Sampling is not selected by default.
About this task
- The generated data is collected over the sampling period and summary information is generated.
- Only numeric (REAL) data is summarized.
- The mean value of data that is collected is recorded. The minimum and maximum values can be recorded, in addition to the mean value.
- An extra column Min & Max shows in the editor with check boxes to specify whether you want to record the minimum and maximum values, in addition to the mean value.
Two scenarios can help you decide whether to use log measurement sampling or not.
- Log measurement without sampling
- A status message is generated every 15 seconds. You use a background test to subscribe to this message and record a certain summary status from the message. In this scenario, the Log Measurement action need not use sampling.
- Log measurement with sampling
- You configure a background test to observe the depth of a queue. The value is tracked many times a second. You do not want to record all of these values. Instead, you enable sampling to record the mean of all the values that are received once every 5 seconds.
To use sampling:
Procedure
-
In
Rational® Integration
Tester Test Factory perspective, double-click the test that you want to add a Log Measurement action to.
The Test Editor opens.
Next, you want to add a Log Measurement action.
-
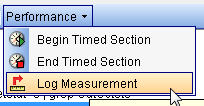
Click .
-
Double-click the Log Measurement action.
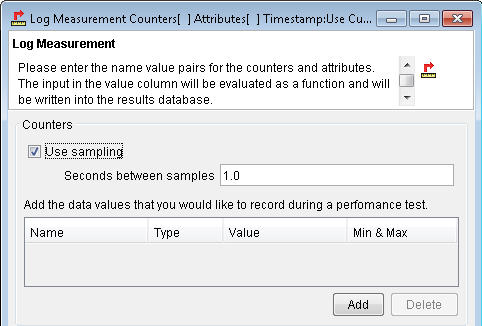
The Log Measurement dialog opens.
- Click the Use sampling check box.
-
Specify the sampling period, in seconds or accept the default value.
Adding data values to record
You must add data values to identify what you want to record during a performance test.
About this task
You use counters to record each data value. Each counter has a name, type and value.
There are two types of counters:
- Numeric (REAL)
- String (STRING)
By default, the number of counters is limited to eight REAL and four STRING. For information about increasing the number of counters, see Modifying counter-limits.
To add counters:
Procedure
-
Click Add under Counters on the Log Measurement dialog.
Tip: To delete a counter, select it on the Log Measurement dialog and click Delete
After a counter is added, you give it a name, type, and value.
The name can contain spaces and can be up to 255 characters in length, although long names are slower to use and harder to display.
-
Select the type of each counter (REAL or STRING) on the Type column.
Restriction: If you clicked the Use sampling check box, you can add only numeric (REAL) data as string values cannot be summarized.
-
Finally, enter a value for the counter or right-click within the fields to select a function or insert a tag.
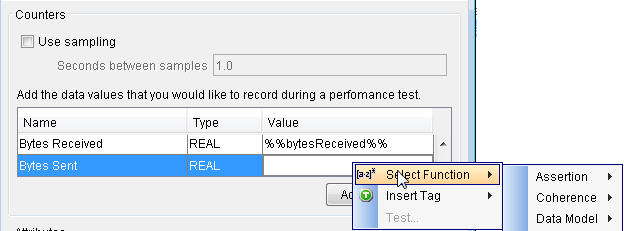
When you use a function, multiple tags can be referenced.
Adding attributes to identify the recorded data
Attributes identify the data that is stored by the counters. You first add an attribute and then give it a name and value.
About this task
The combination of attributes can identify a series of data items because they are grouped and plotted as a single data series (line) in the performance charts.
By default, the number of attributes is limited to five. For information about increasing the number of attributes, see Modifying attribute-limits.
To add attributes:
Procedure
-
Click Add under Attributes on the Log Measurement dialog.
Tip: To delete an attribute, select it on the Log Measurement dialog and click Delete
After an attribute is added, you can give it a name and a value. Each name and value can be up to 255 characters, including spaces. The value can be text or numeric. Tag values can be used, but remember that counters are grouped by the combined values of the attributes.
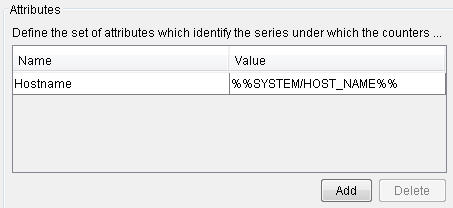
Important: If you use a tag value, which is different for each iteration of the test, none of the counters are in the same data series in the performance charts (that is, they are all plotted on separate lines).A typical use for attributes is to record the source of received messages such as the server or topic/queue name. For example, you might plot results by message source to see how the various parts of the system are performing.
-
Finally, enter a name and value for the attribute.
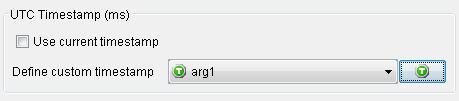
Using a custom time stamp with the recorded data (optional)
A UTC time stamp, which is generated by Rational® Integration Tester when the test is run, is stored with each set of counters. You can use this generated time stamp or define a custom time stamp.
About this task
By default, the UTC time stamp that is generated by Rational® Integration Tester is used (Use current timestamp check box).
To define a custom time stamp:
Procedure
-
Clear the Use current timestamp check box.
Next, you can define the custom time stamp.
-
Select an existing tag or create a new tag to use by clicking the new tag
 button.
 Important:
- A custom time stamp, while provided in a tag, must be in UTC format.
- Performance charts display all data that was saved from the start of the test to the end of the test. If you use a tag whose time stamp values are outside of the test time (that is, before or after), the counter-data does not display on the charts.
- Click OK to save and close the Log Measurement dialog.