Viewing On App and Off App response time
When you initiate a test run from the test workbench, by default, the response time is collected and displayed in the Mobile and Web UI Report after the run. This report shows the overall response time for each test step. The response time is also displayed on the Step Performance tab of the statistical report. This report shows the average response time for each test step.
About this task
To view the On App and Off App data for all of the steps on a page,
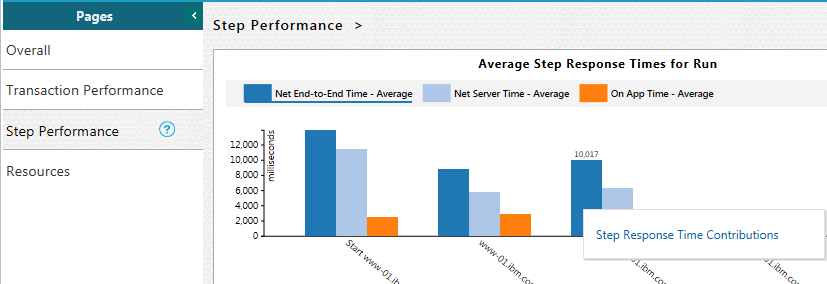
from the Step Performance page, click the > symbol after the Step Performance
header and then click Step Response Time Contributions. 

Procedure
- Click Run Test in the test workbench.
-
In the Run Configuration wizard, select the Firefox or Chrome browser
and click Run.
When the test is completed, the statistical report displays graphs that represent the response time for each step in the test. By default, only the 10 highest response times are collected during playback. You can modify the filter by using the context menu on the legacy report and by going to the edit mode on the web report.
-
Click any response time graph and select Step Response Time
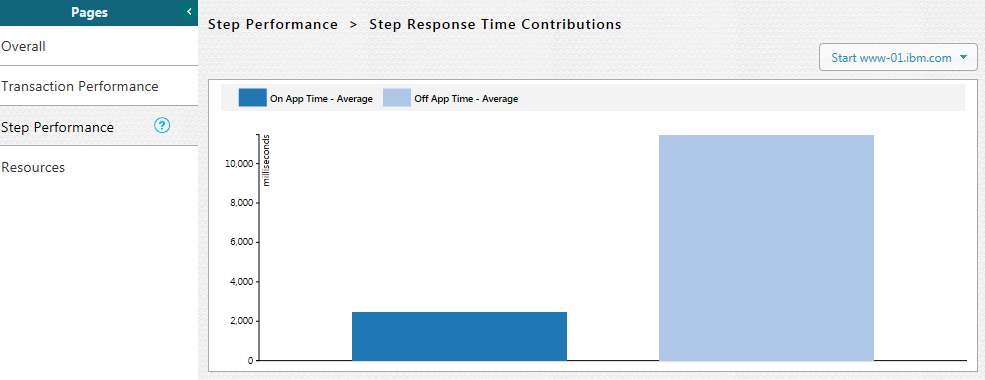
Contributions. The report displays two bars, one to show the time spent by the step on
the application (On App Time) and another to show the time spent on the
network and server (Off App Time).
Note: The Step Response Time Contributions option is available only if you played back the test with the Firefox or Chrome browser.
Figure displaying the Step Performance tab with Step Response Time Contributions context menu.

Figure displaying On App Time and Off App Time.

- To return to the main page, click the Step Performance link at the top of the Step Performance tab.