Test log details
You can find information about the details that are displayed for a test log on the Test log page. You can also find information to use the different options in the UI to change the view of the test log, find details of the events captured, navigate through the log, view or download attachments that are captured.
Before you can view the test log, you must have started a test run and opened the test log that is displayed on the Test log page.

| Details about... | Examples as displayed in the Test log page... |
|---|---|
| The project name | An example of the project name that is displayed is as
follows: |
| The name of the page | An example of the page name that is displayed is as
follows: You can click the Test log link to view the test logs of all tests that ran in your project, if you are viewing the test log of a specific test run. |
| The name of the test asset | An example of the name of the asset that is displayed is as
follows: |
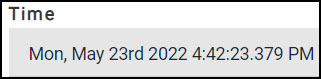
| The date and time when the test run was started from the Execution page | An example of the date and time when the test run was started
that is displayed is as follows: |
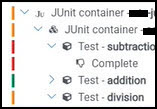
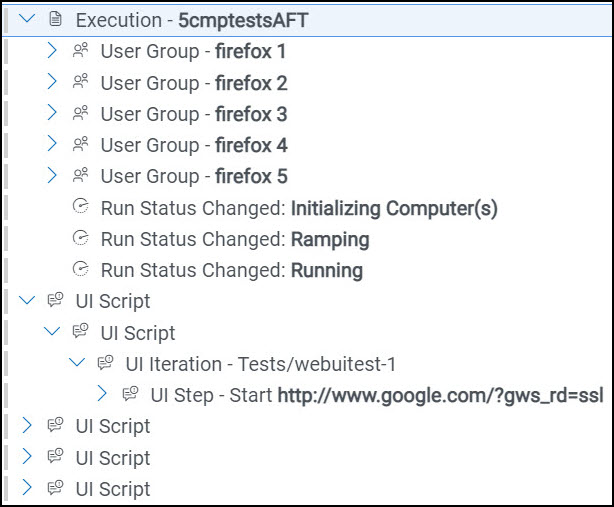
| The activities and events captured in the test log are displayed in the Tree view in the Test log panel. | An example of the log in the tree view that is displayed is as
follows: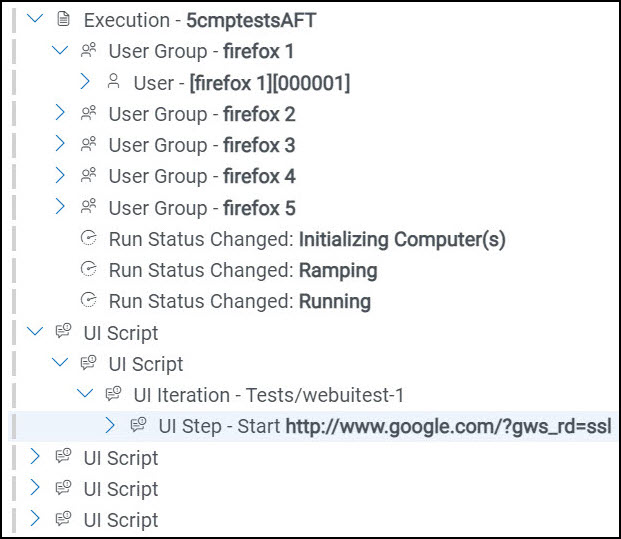 |
| An event in the test log. Details of the event is displayed in the Properties panel. | An example of the details that is displayed in the
Properties panel is as follows: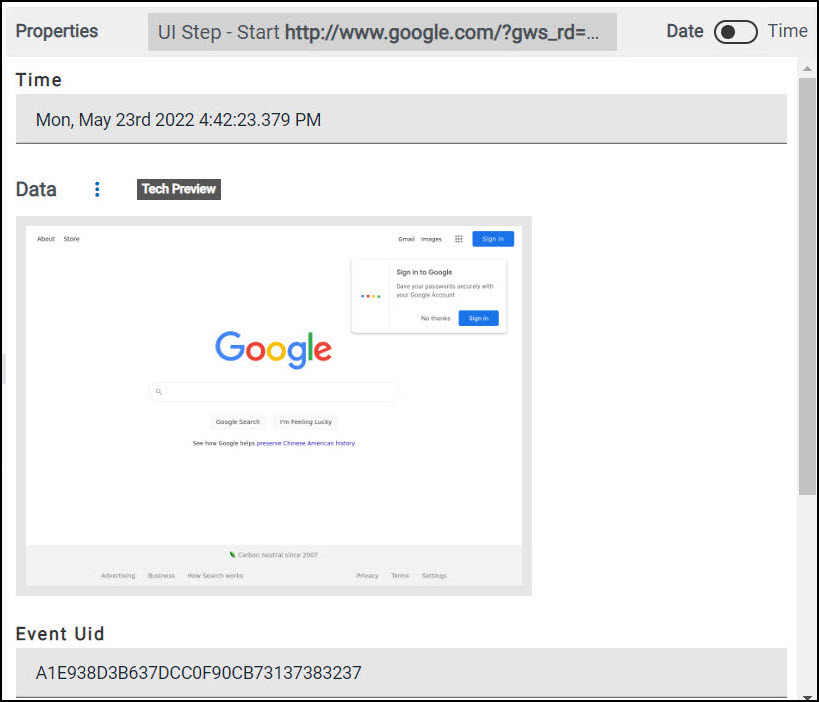 |
|
The link to a URL that is recorded in an event. The URL is displayed as a link. When you click this link, the specific URL opens in a web browser. |
An example of a link recorded in the event. |
| An attachment of an event in the test log. The details of the attachment is displayed in the Properties panel. | An example of a text extracted from the attachment.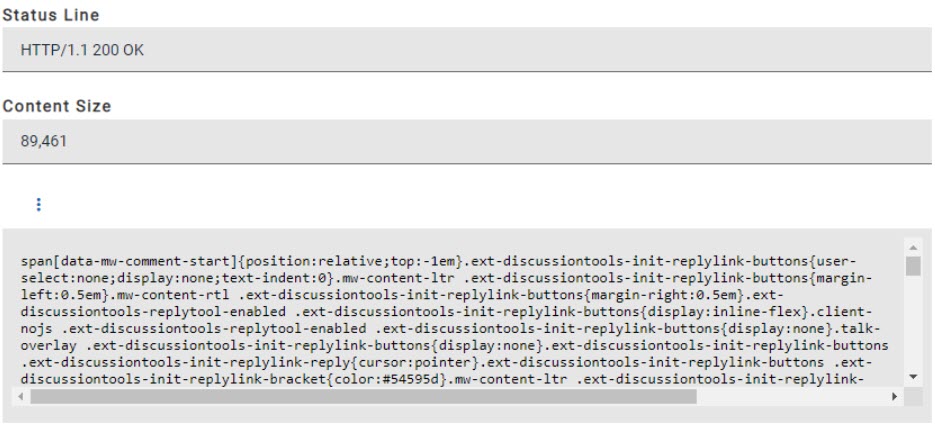 |
| The reason of a Verification Point (VP) that is captured in an event in the test log is displayed in the Properties panel. | An example of the reason in a VP that is displayed in the
Properties panel is as follows: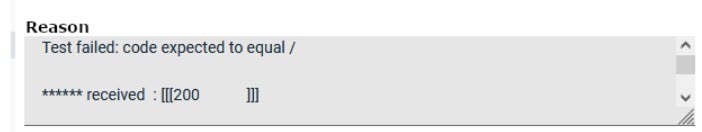 |
| Task | Action |
|---|---|
|
Changing the Tree view to a Flat
view for the display of events in the test log
panel.
Note: The Tree
view is the default view of the events in the
test log. |
Click
Note: You can change the view from the one that is displayed by
clicking |
|
Expanding the display of events in the test log panel. |
Click For example, the collapsed view in the test log panel can be as
follows: When the event is expanded, the view in the test log panel can be
as follows: |
|
Collapsing the display of events in the test log panel. |
Click |
|
Viewing primary activities when all activities are displayed. |
Perform the following actions in the test log panel:
|
|
Viewing all activities when only primary activities are displayed. |
Perform the following actions in the test log panel:
|
| Viewing failures captured in the test log. |
The test log displays events marked with a colored vertical bar
as follows:
 You can navigate up and down in the view from one error
or failed event to another one by using arrows You can navigate up and down in the view from one error
or failed event to another one by using arrows |
|
Searching for events in the test log. |
In the search bar, you can enter text to find instances of events and properties that match with the text you entered. As a result of the search, the title of the nodes in the view and the names of the properties are highlighted. When the number of results found is displayed, you can press the F3 key to navigate from one search result to another in the tree view or flat view. You can press Ctrl and F3 to navigate from one result to another in the properties pane. |
|
Viewing the properties related to the event that you select in the test log panel. |
When you select an even in the test log panel, its properties are displayed in the properties panel. For example, the details that are displayed for an event can be
as follows:
You can view the following information:
|
|
Viewing all test logs in the Test log page. |
When you view the test log of a specific test asset and you want to return to the Test log page to view the test logs of the other test assets, you can click the Back to test logs option. |

 When the
 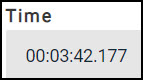 This time is the time that has elapsed from
the start of the test run to the event in the test
step.
This time is the time that has elapsed from
the start of the test run to the event in the test
step.