Lesson 4: Viewing test results
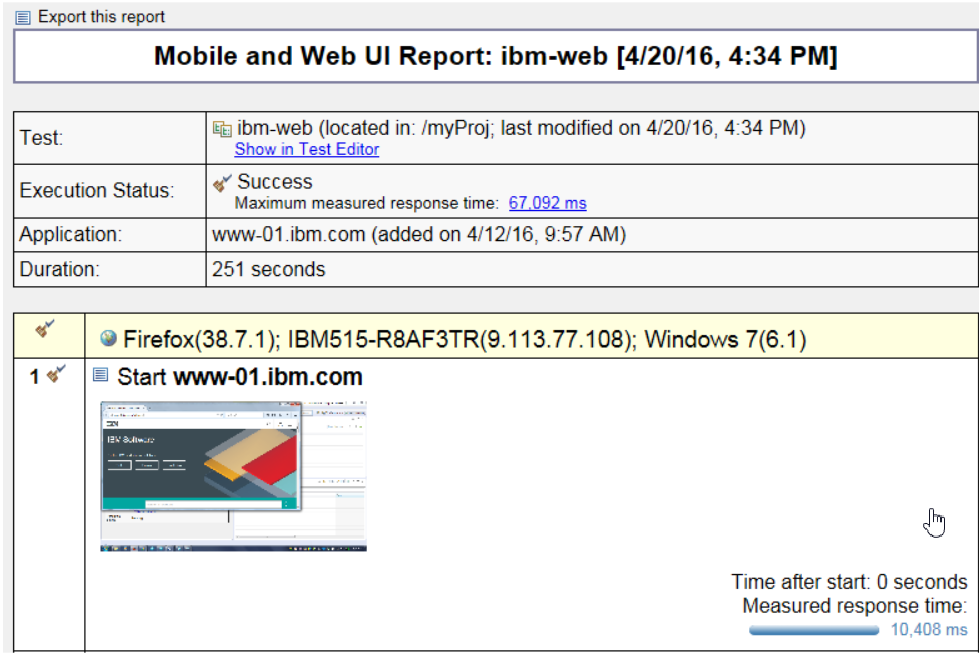
The reports display whether the test run was successful. The UI Report is the primary report for a Web UI test. It displays each of the steps with the screenshot of the UI and the overall response time. If a test run fails, the error message is displayed against the step in the report.
The report is placed in the Results folder of the Test Navigator view. You can view the report later by double-clicking the report in the Test Navigator.
The test log contains a record of events that occurred during a test run, and the status of each verification point. To view the test log, right-click a test result in the Test Navigator view and click Display test log.
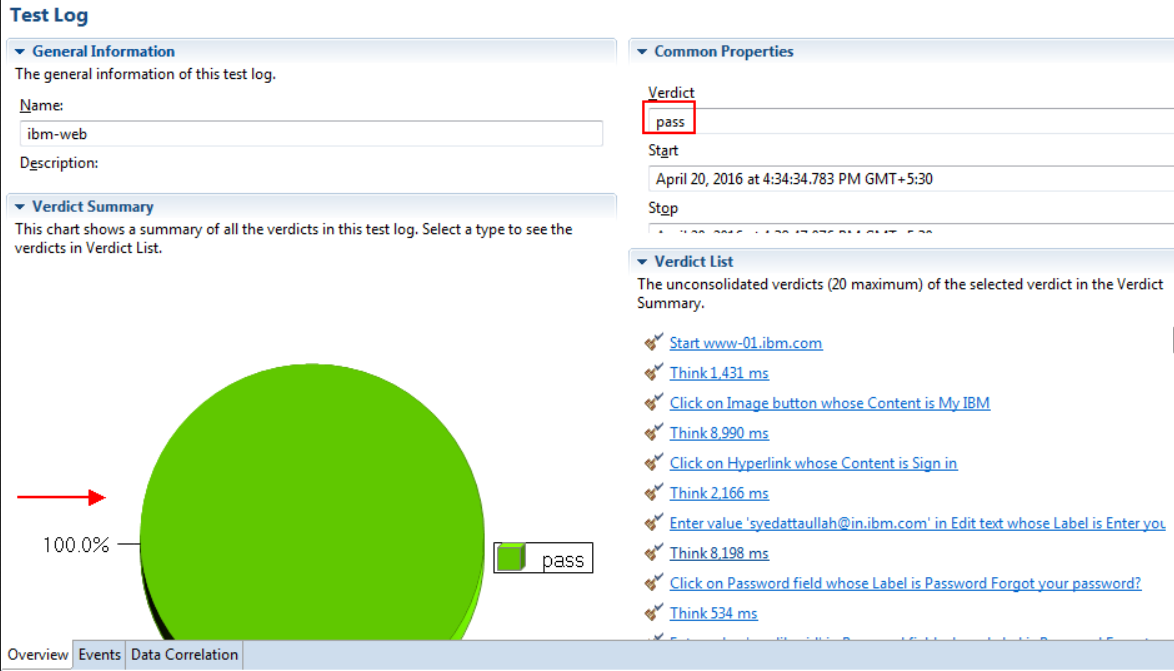
- Pass indicates that all test steps and verification points matched or received the expected response. For example, a verification point is set to PASS when the expected response is received during playback. If your test does not contain verification points, PASS means that the steps found the UI controls and there was no timeout.
- Fail indicates that at least one test step did not find a UI control, verification point did not match the expected response, or there was a time out.
- Error indicates that the test failure was caused by factors outside of the test script such as system issues or unhandled exceptions.
- The verdict is set to Inconclusive only when the test did not execute and gave test result.
To find the error message in the log, click the Events tab. The step that caused error would be highlighted with a red cross mark.
In addition to testing the functionality of the web application, Rational® Functional Tester also captures performance data of the application. If you ran the test with the Firefox browser, like you did for this tutorial, the Step Performance report displays the response time for each step. With this report, you can identify which step or user action caused more delay than others.
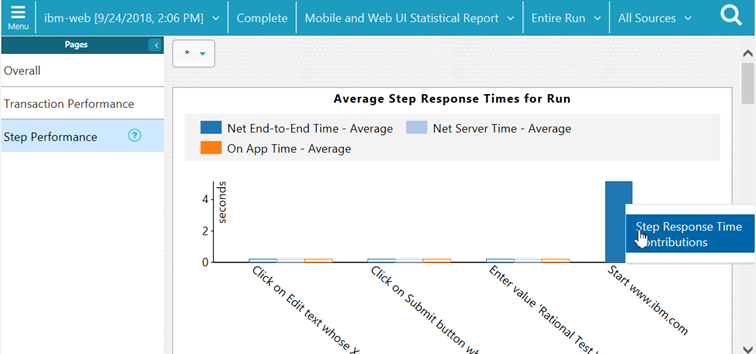
From the Step Performance report, you can drill down further to view the breakdown of the response time for each step. For example, in the screenshot above, the seventh step took 67,092 milliseconds. For further analysis of the step, right-click it and select Display Step Response Time Contributions.
You can see that the time taken by the request on the application is more than the time taken outside of the application such as on network and server.
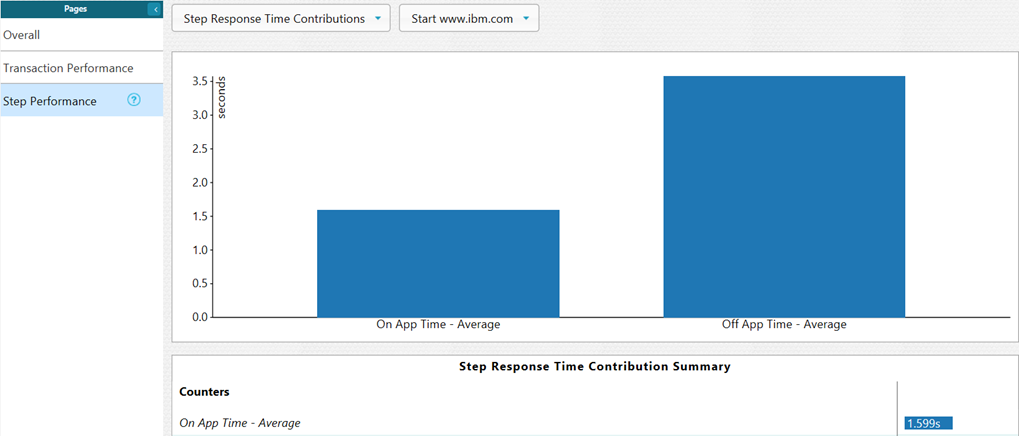
You, as a tester, can show this report to the development team to help them identify the cause of the delay by debugging the application on the specific step.
Now that the test script works fine, you can modularize it for better maintenance.