Stepping through an application in the EGL debugger
This topic offers guidance on the basic steps of debugging a program in the EGL debugger.
Strategies for debugging an application are beyond the scope of this documentation, but in general the heart of the debugging process is identifying the source of a problem in the code. For example, if your program ends abnormally, you can use the debugger to step through the code and find the point at which the program fails. If the program gives unexpected output, you can use the debugger to track the values of variables and find the point at which the output deviates from the expected.
The debugger always starts debugging from a program part. If you want to debug another logic part, such as a library, you must step into the other logic part from a program. In some cases you might benefit from writing a simple program with no other function than to call the logic part that you want to debug.
Prerequisites
- An EGL project
- An EGL program to debug
program myDebugTestPgm type BasicProgram

  function main()

    //Provide some initial values for the array of items.
    customerItems items[3];
    customerItems[1].itemNumber=1;
    customerItems[2].itemNumber=2;
    customerItems[3].itemNumber=3;
    customerItems[1].itemCost=12.50;
    customerItems[2].itemCost=200;
    customerItems[3].itemCost=49.95;
    customerItems[1].itemQuantity=30;
    customerItems[2].itemQuantity=10;
    customerItems[3].itemQuantity=60;

    counter int;
    orderTotal float=0;

    //Calculate the total cost of the items.
    //Use the discountPrice function to get the discounted cost of each item.
    for (counter from 1 to customerItems.getSize() by 1)
      orderTotal += discountPrice(customerItems[counter].itemCost,
                                  customerItems[counter].itemQuantity);
    end // for loop

    //Write the output to the console.
    SysLib.writeStderr("The total cost for the order is $" + orderTotal);
  end // main

  //Return a total price for a group of items
  //based on the item price and a quantity discount.
  function discountPrice(itemCost float in, itemQuantity int in) returns(float)
    discountRate float=0;
    quantCost float=0;

    //Determine the discount for each quantity.
    //Discount 20% for more than 50 items.
    //Discount 5% for more than 20 items.
    case
      when (itemQuantity > 50)
        discountRate = 1/5;
     when (itemQuantity > 20 && itemQuantity <= 50)
       discountRate = 1/20;
     otherwise
       //bug - division by zero
       discountRate = 1/0;
     end

    //Multiply the cost of the item, the number of items,
    //and the discounted price.
    quantCost = itemCost*itemQuantity*(1-discountRate);
    quantCost = MathLib.round(quantCost, -2);

    return (quantCost);
  end // function discountPrice

end // program

record items type BasicRecord
  itemNumber    int;
  itemCost      float;
  itemQuantity  int;
enddiscountPrice function and
the expression 1/0. In this case, the error is easy
to see, but in other cases you might not be able to find the error
so easily. Your first step in identifying the source of the error
might be to run the program in the debugger with breakpoints to find
where the program fails.Adding breakpoints
You can mark one or more lines of code as breakpoints. When the debugger encounters a breakpoint, it pauses before running the associated line of code. You then have the option of checking the current values of program variables before telling the debugger how to proceed. Breakpoints do not affect the generated source in any way; they are meaningful only during the debugging process.
discountPrice function
because the error tells you that this function is where the error
occurred. Breakpoints are marked with blue circles in this gray area: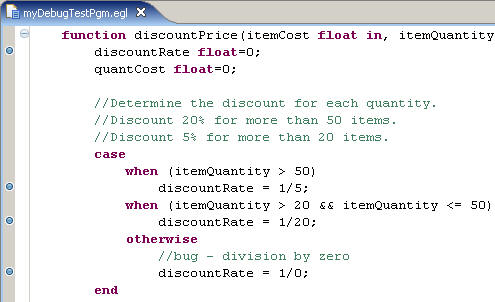
- An assignment statement, such as:
myString = "Hello"; - A variable declaration that includes an assignment, such as:
myInt int = 5; - A call to a system function or other EGL function, such as:
SysLib.writeStderr("Hello"); - A loop or comparison statement, such as:
if (myInt == 5)
- A variable declaration that does not include an assignment.
- An end statement.
- A line of code that begins with function, or that begins with program, package, or any other line that declares a logic part. However, you can set a preference to have the debugger treat the first line of each program as though it contained a breakpoint. See Setting preferences for the EGL debugger.
- Any line within a data part.
- A blank line or a line that consists only of a comment.
For more instructions on using breakpoints, see Using breakpoints in the EGL debugger.
You can
debug a program without using breakpoints. If you check the preference , it has the same
effect as setting a breakpoint at the first executable line inside
the main() function of the program. From this point
you can step through or around succeeding lines of code, that is,
execute a single line and pause. For more on the step commands, see EGL debugger controls.
Running a program in the EGL debugger
After you have added breakpoints to your program, or set the Stop at first line option (see "Adding breakpoints" earlier in this topic), you can run it in the debugger.
- Have the debugger to create a launch configuration automatically when you start debugging.
- Create a launch configuration manually. See Creating a launch configuration in the EGL debugger for more information.
- In the Project Explorer view, right-click the EGL source program
that you want to debug and then click . The
debugger performs the following tasks:
- If no launch configuration exists for the program, the debugger creates a default launch configuration. You can view this configuration by clicking .
- Depending on your workbench preferences, the debugger might switch to the Debug perspective automatically or prompt you to do so. You can switch perspectives manually by clicking .
- The debugger begins running the program.
- After the debugger has started running the program, it continues
until it encounters a breakpoint, or, if you have set the preference
for it, finds the first line of executable code. At this point, the
debugger pauses and displays the following information:
- The EGL editor highlights the line about to be executed.
- The Variables view shows the value of all the variables in the current logic part, including the value of system variables. You can use this view to track the value of a variable through the program. You can also change the value of a variable while the debugger is paused at a breakpoint.
- The Debug view lists the threads running within the current run unit. In simple terms, this view shows which program or logic part is currently running. Use this view to resume or stop the debugging process.
- The Breakpoints view lists the breakpoints in the program. From this view, you can disable a breakpoint temporarily by clearing its check box.
- When you want the debugger to continue, click the Resume button
at the top of the Debug view. The debugger continues to the next breakpoint.
You can also use one of the Step buttons to see the program execute
the next line and pause again.
In the example program, you can run the program from breakpoint to breakpoint until the debugger reaches the line
discountRate = 1/0;, at which point the debugger returns the same error that you see in the console when running the program. - When you are finished debugging, click the Terminate button at the top of the Debug view to stop the debugger or click the Resume button to allow the program to finish running.