Example: Logging measurements to the results database

In this example, you use a background test and the log measurement action to act as a custom probe for the system under test.

About this task

This example gathers data about the bytes sent and received by the system. While this data can also be gathered by a probe, this example shows you how to gather the information manually.

Creating a measurement test

About this task

You use a background test for two reasons. First, it means that there is no need to change your load-generating test. Second, you do not need to have your probe constantly running because the test gathers your data every 2 seconds instead of constantly polling the system and possibly adding extra unintended load.

Procedure

  1. From the Test Factory perspective, create a test that is named byteMonitor (New > Tests > Test).
  2. Add a Run Command action to the test and open it.
    1. On the Config tab, enter some commands.
      If you are using Red Hat Enterprise Linux enter these commands.
      netstat -s | grep InOctets
      netstat -s | grep OutOctets
    2. Make sure that the Wait for command execution to finish check box is selected.
    3. Click Test.
      Two lines of data for stdout show similar to the following example:
      InOctets: 477678994
      OutOctets: 435217918
  3. Switch to the Store tab and store the two numbers into separate tags that are called BytesSent and BytesReceived.
    1. Right-click stdout and select Contents > Edit.
    2. Make sure that you are looking at the Store tab within the Field Editor window that opens, and then click New.
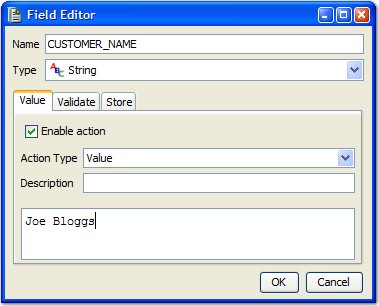
    3. Complete the Field Editor window for each tag as shown.

      Field editor window

      In the Expression section, for the BytesReceived tag the regular expression \d+ is used to match a number. The Instance option is set to 1, which extracts the first number that is found in the string. In the example string, this stores 477678994 into the BytesReceived tag. If you test by using the earlier example, you see that the Result field is set to 477678994.

      In the Expression section, for the BytesSent tag the regular expression \d+ is used to match a number. The Instance option is set to 2, which extracts the second number that is found in the string. In the example string, this stores 435217918 into the BytesSent tag. If you test by using the example above, you see that the Result field is set to 435217918.

    4. Close the Field Editor window.
  4. Close the test action.
  5. Check that the test is working as expected. Add a normal Log action, and use that action to log the values that are captured in the BytesReceived and BytesSent tags to the console. Then, run the test, and check that it works. If it does not, check the preceding steps to make sure that everything was entered correctly.

Logging measurements to the results database

About this task

You now have some measurements that are taken from the system under test. Next, you log those measurements to the results database during your performance test that uses the Log Measurement action.

Procedure

  1. From the Test Factory, delete or disable the Log action. Then, add a Log Measurement action (Performance > Log Measurement) after the Run Command.
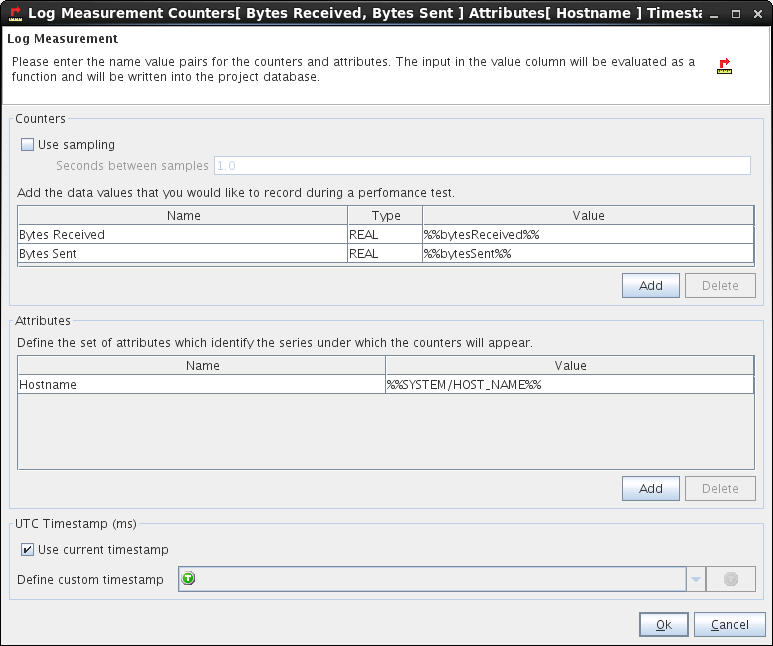
  2. Now set up the Log Measurement action. First, you indicate what data you want to capture. Click Add in the Counters section to add a value to monitor. A new empty row is added to the table of data values.
    1. Enter Bytes Received in the Name column, REAL in the Type column, and %%bytesReceived%% in the Value column.
    2. Click Add again to add a second row of data. This time, enter Bytes Sent, REAL, and %%bytesSent%%.
    3. Each value that you monitor must be filed under an attribute. You can use the hostname for this purpose. Because you have only one host, it does not make a difference, but if this test was running on multiple hosts, then you can see the network statistics for each host separately. Click Add in the Attributes section.
    4. For the Name field, enter Hostname. For the Value field, enter the tag %%SYSTEM/HOST_NAME%%.

      The Log Measurement action is now set up. Check your entries before you click OK to close the test action.

      Log measurement

  3. Save and close the byteMonitor Test.

Adding a background test to a performance test

Before you begin

You must have a performance test to add a background test to it. For more information, see Creating performance tests.

Procedure

  1. Create a copy of a performance test, and call it customLogging.
  2. Edit the customLogging Test, and right-click the Performance Test label on the left side of the editor; you see the options for adding load-generating and background tests. Add a background test.

    Add background test

  3. On the Execution tab for the Background Test, select byteMonitor for the Test Path field. Make sure that Terminate on failure is not selected
  4. Switch to the Engines tab, and then click Add. There is only one engine available, as before. Select it.
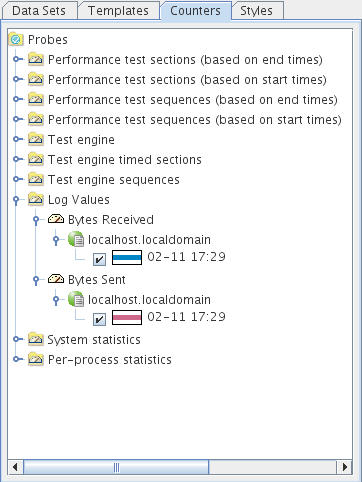
  5. Save the customLogging test, and run it in the Test Lab perspective. View the results in the Results Gallery. From the Results Gallery, select the customLogging test, and then click Analyze. The counters can be found in the Log Values section. There is one each for Bytes Sent and Bytes Received. Select them both.
    Counters

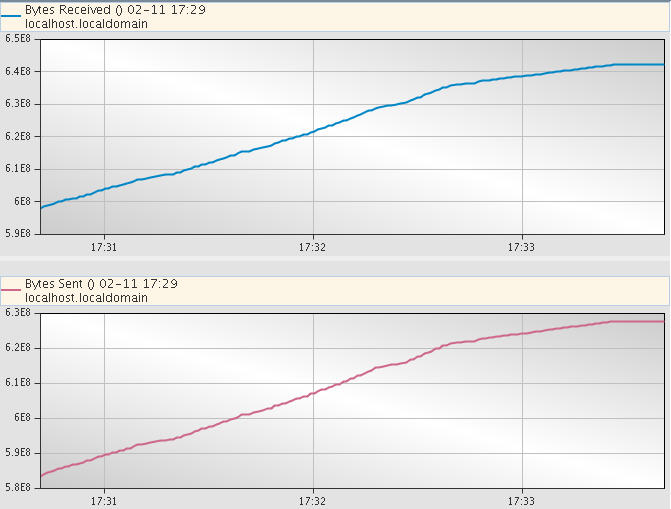
    In most cases, the charts look similar, though not quite the same. You might want to put the data onto two separate axes to get a better view of your data.
    Log measurement chart