Viewing results of multiple tests
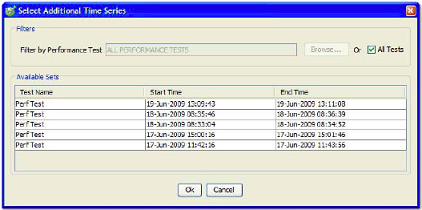
Additional data sets can be added to a chart, including those from other performance tests.
About this task
This enables you to plot data from multiple tests together on the same chart.
To add data sets to a chart:
Procedure
- On the Data Sets tab
of the chart window, click Add.
- Click Browse to locate
a specific set of results, or select the All Tests check box
to display all available results. Note: Click the column headings to sort the displayed results by that column.
- Select one or more of the available results sets and click OK.
