HTTP performance test reports
When you test an HTTP system, reports are produced during a run and saved after a run. You can then analyze the reports to know the performance of the system under test.
In a performance report, you can sort the order of HTTP pages that are captured in a test or schedule either by alphabetical order or order of execution of the HTTP pages. The default sorting of the HTTP pages is by order of execution.
You can either click the Execution order icon or the Alphabetical order icon
to toggle between the sorting options. You can also click
the Up Arrow icon
![]() to sort the HTTP pages in the correct order of execution or
the correct alphabetical order. Similarly, you can click the Down Arrow icon
to sort the HTTP pages in the correct order of execution or
the correct alphabetical order. Similarly, you can click the Down Arrow icon ![]() to sort the HTTP pages in the reverse order of execution or the reverse alphabetical
order.
to sort the HTTP pages in the reverse order of execution or the reverse alphabetical
order.
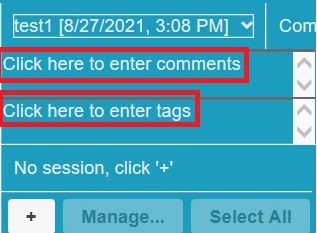
If you want to identify specific test results, you can enter a tag or comment in the corresponding fields of the performance report to associate it with the test result as shown in the following image:

After the test run is complete, you can open the test results. You can click the
Copy icon to copy the contents of the table in the HTML format from the report. You can
then paste the copied content into Microsoft Excel or any other application, such as
browsers or scripts where you want to use the report information.
You can view the following pages in the Performance report:
- Overall page
- Summary page
- Page Performance page
- Page Details
- Page Element Details
- Response vs. Time Summary page
- Response vs. Time Detail page
- Page Throughput page
- Server Throughput page
- Server Health Summary page
- Server Health Summary page
- Caching Details page
- Resources page
- Page Element Responses
- Page Response Time Contributions
- Page Size
- Errors
- Page Health