Chart counters
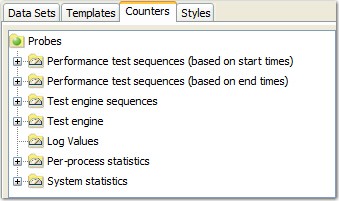
The Counters tab on the chart windows displays the available counters, grouped by source.
Each counter may be plotted individually on the chart.

Performance data will always be available and, depending on the probes that were used in the test, there may also be additional data.
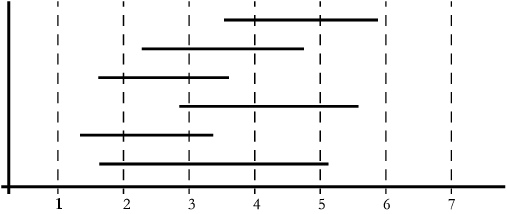
Performance counters are provided for the entire test (start to finish) and for any timed sections within the test. Each of these is available based on start times and end times (that is, start times for iterations started during this period and end times for those ending during this period). The following diagram may help to explain this.

The diagram above shows the execution of several test iterations by time. No iterations start or end in the first time period, so all statistics will be zero. In the second time period, three iterations start, so if you are using counters based on start times, figures will be reported for the three periods. Counters based on end times will yield no data because no iterations end in this period. In time period six, only figures based on end times will be reported because three iterations end here.
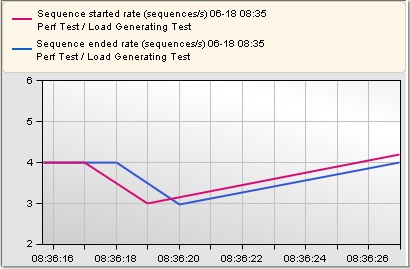
The following chart is of a number of test iterations that all take 1000ms to complete. The plots are Sequence started rate and Sequence ended rate, and you can see that the ended rate lags the started rate by exactly 1000ms.

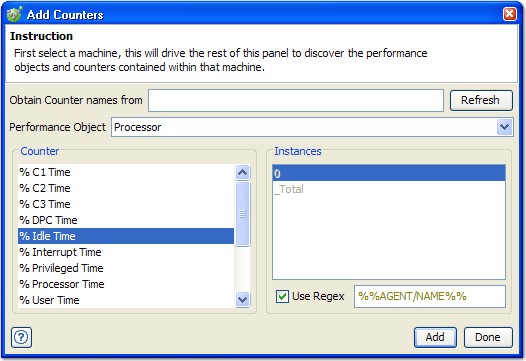
Probe counters are described in Deploying probes, but the built-in test counters are listed below.
| Counter Name | Description |
|---|---|
| Average duration | The total time of all iterations (started or ended mode) this period, divided by iterations (in milliseconds). |
| Maximum duration | The longest iteration time (in milliseconds). |
| Minimum duration | The smallest iteration time (in milliseconds). |
| Started rate | The number of iterations started this period (in started mode). |
| Ended rate | The number of ended iterations (in end times mode). |
| Passed rate | The number of passed iterations this period. |
| Failed rate | The number of failed iterations this period. |
| Time-out rate | The number of tests that failed due to timeouts on received messages. |
To add counters to a chart, expand the counters tree and select the required entries. If multiple data sets are selected, they will be displayed in the list, grouped by performance test and test run.
