Troubleshooting the HTTP/TCP proxy
While using the HTTP/TCP proxy, you might encounter some problems that you can troubleshoot.
HTTP/TCP proxy traffic
Logs can help you determine why traffic failed to be routed to a virtual service (stub). If you do not see events in Recording Studio while you try to record proxy traffic, use a similar process, although the exact log messages might differ.
For information about configuring the HTTP/TCP proxy logs, see HTTP/TCP proxy logs.
- In IBM® Rational® Test Control Panel, verify
that the stub (or Recording Studio) has registered a rule and is displayed as a rule in the
Network Dashboard.
- Expand the Rule, and check the information in the Recording To field under the Details tab section in the appropriate domain to make sure that the rule was sent to Rational® Test Control Panel.
- If the rule was not applied to the proxy, complete these steps:
- Verify that you are looking at the HTTP (or TCP, if appropriate) proxy.
- Verify that the rule type is HTTP (or TCP, if appropriate).
- Verify that the proxy is either registered for all environments or is registered for the environment that the rule was added for.
- If you see more rules than you expect, try to delete all the rules from your environment and
restarting your stub. You can delete rules from the Network Dashboard in
IBM® Rational® Test Control Panel. You can only delete rules you created by clicking the Delete icon for the
rule. If other users created rules for their stubs that clash with your rules, and you do not have permission to delete those rules, try one of these solutions:
- Create an additional proxy, then configure that proxy to register with only one domain, or with one environment in that domain. Make sure that each environment is being used for only one set of stubs. For more information about how to set up multiple proxies from a single installation, see this developerWorks® article: Virtualize multiple behaviors in parallel with Service Virtualization.
- Run the Rational® Test Control Panel installation on multiple servers. Choose the option to install the proxy only, and configure the proxy to connect to your current Rational® Test Control Panel.
- Use the JUL file to determine whether the proxy received the request at all, and, if so, why the rule did not match. In the proxy-logging.properties file for the java.util.logging (JUL) log file, set the level to FINE as follows:
product_packages.level = FINE
com.predic8.membrane.level = FINE
Alternatively, enable diagnostic logging for the proxy and set it to DEBUG level.
For more information, see Enabling and disabling remote diagnostic logging for the HTTP/TCP proxy.Restart the proxy, run your test, and check the log file. If traffic was routed to the proxy, a message records where the request was routed to or shows that the request was passed through to the live system. Log messages are also generated for filter conditions such as host and source host.
If no such messages are displayed in the log, then the client application did not send its traffic to the proxy. Check the proxy settings for your client application.
If you see log messages that indicate that the request was received by the proxy, but the request was not correctly routed to the stub, such as Request for host example.com:80 to be routed to live system, you can obtain more information about the failure:- Find the section of the log where routing rules are tested. This section begins with the message Testing request against routing rules (or Testing request against recording rules, if appropriate) and ends with No more rules to try. The other messages for routing and recording are similar, in many cases the same. Make sure that you are looking at the correct set of messages.
- A "did not match" message, such as Request HTTP method POST does not match condition: GET indicates that a single filter condition failed. If this message is followed by a message that says Evaluating next condition of OR statement, then the process moved to the next OR condition for that rule, which means that the failed match did not cause the entire rule to fail.
- The message Rule condition failed. Trying next rule means that all the OR conditions are exhausted and no matches were found.
- The message Rule condition matched. Continuing to check other rules indicates that the filter for a rule entirely matched, or that at least one of its OR branches was satisfied. One of the activities for that condition will be used. This message is followed by a message at a FINE level that specifies the activity that was selected. Other rules might be checked after the Rule condition matched message. The last rule to match before the No more rules to try message is the rule that is used.
- If multiple stubs or recording monitors are found for the same transport or operation, the rules that those stubs or monitors create have the same conditions. These rules with duplicate conditions are merged into one rule that has multiple activities. Therefore, messages for that condition are logged only once. If the condition matches, the request is either sent to all event monitors for recording or one stub is chosen by using a round-robin algorithm for routing. The chosen
activities are logged. In many cases, these log messages can show why the rule that you expected to route or record the traffic did not match the request that the proxy received.Note: When there are multiple stub instances of a stub with the same routing rules and if only a subset of messages are being processed by the stub instances, then it might be because of the round-robin feature that is used to route the messages between the stub instances. See Virtualizing HTTP. You must check the routing rules defined for the stubs in Rational® Test Control Panel.
To see a sample log file that shows a message being routed to the live system, see Sample log file 1. Note these points about the file:- The name of the logger contains valuable information about the source of the messages, as in these examples:
com.greenhat.proxy.http.routingindicates HTTP routingcom.greenhat.proxy.http.recordingindicates HTTP recordingcom.greenhat.proxy.tcpindicates TCP.
The log messages do not typically indicate which protocol generated them or whether they are a result of routing or recording.
- These lines from the sample are particularly helpful:
Request received for host example.com:80
Testing request against recording rules.
No more rules to try. No match found for request.
Testing request against routing rules.
Request HTTP method POST does not match condition: GET
Rule condition failed. Trying next rule.
No more rules to try. No match found for request.
Request for host example.com:80 to be routed to live system
In this example, Recording Studio had no recording rules. The one routing (stubbing) rule failed to match because the request was an HTTP POST and the stub created a rule for HTTP GET requests.
- Use the JUL file to track progress through the filter conditions.
Set the
com.greenhat.proxy.debug.verbosesystem property to true in one of these ways:- If you are running from the console or command line, edit the
proxy startup script (startup.bat or startup.sh)
and add
-Dcom.greenhat.proxy.debug.verbose=trueto the other-Darguments on theRUNJAVAline. - If you are running the proxy as a Windows™ service, run
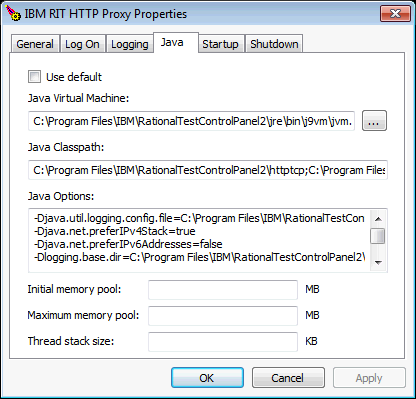
editProxyService.bat from an Administrator command prompt and add the argument
on the Java page.

Restart the proxy, run your test, and check the log file. This log now shows all successful matches against URL prefix, port, and so on. This information can help you track the request as it progresses through the conditions of the various rules.
To see a sample verbose log file that shows one condition that matches, see Sample log file 2. Note these key lines, with the new addition in bold:Testing request against routing rules. Request destination port matched condition: 80 Request HTTP method POST does not match condition: GET Rule condition failed. Trying next rule. No more rules to try. No match found for request. Request for host example.com:80 to be routed to live systemTo see a sample log file with the level set to FINE that shows successful routing to a stub, see Sample log file 3.
To see a sample log file with the
com.greenhat.proxy.debug.verbosesystem property set to true, see Sample log file 4. This file shows that all conditions match and that the traffic is successfully routed to the stub. - If you are running from the console or command line, edit the
proxy startup script (startup.bat or startup.sh)
and add
Memory usage
If the proxy configuration has a large number of port-forwarding rules, or there is a high volume
of traffic, the HTTP Proxy might require more memory. In this case the proxy might exit with
java/lang/OutOfMemoryError.

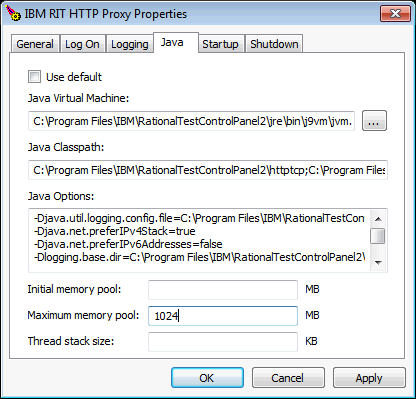
-Xmx parameter. For
example, to allow a Java heap of up to 1 GB in /opt/IBM/RationalTestControlPanel/httptcp/startup.sh:
"$_RUNJAVA" -Xmx1024m -Djava.util.logging.config.file= ...