Real-time abend analysis
When a program abends, the abend processing (MVS or subsystem) is intercepted and Fault Analyzer is automatically invoked via an appropriate exit for the processing environment. See Exits for invoking Fault Analyzer for detailed information about the types of exits available.
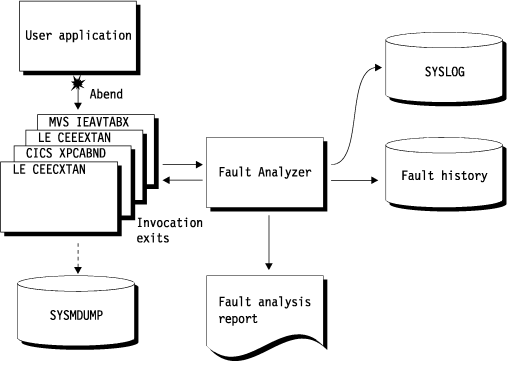
For an example of a real-time fault analysis report, see Sample reports.
Fault Analyzer is designed to only be invoked for the first abend under a given TCB.
If Fault Analyzer deems the analysis to be successful, and either a SYSMDUMP, SYSABEND, or SYSUDUMP was specified for the abending job step, then Fault Analyzer tells MVS to suppress the dump.
- The number of pages exceed an installation-defined limit (see MaxMinidumpPages)
- The fault is a duplicate of another fault (see NoDup)
- An End Processing user exit requested the minidump to be suppressed (see End Processing user exit).
The minidump permits reanalysis of faults that occurred in any processing environment, regardless of whether an MVS dump was also written.
If the application does not abend, then Fault Analyzer consumes no processing resource. This parsimony makes Fault Analyzer equally suited for application development, testing, or production environments.
Instead of forcing application developers and maintainers to interpret a low-level system dump or system-level error messages, the fault analysis report describes the fault in terms of the application code. Where possible, the report quotes the source statement where the abend occurred and, for COBOL and PL/I, the names and values of data items used in the statement.
Generally, when the associated compiler listing (or side file) of the abending program is available online, then application abends are isolated down to the program source statement involved in the abend (see Compiler listing or side file selection criteria for information about the criteria used when selecting compiler listings or side files). When the listing is not available, the problem is diagnosed down to program name and offset, with disassembly of the machine instructions.
For much of the time, the analysis report provided by Fault Analyzer and written to the job output is adequate, and you do not need any further fault information for successful problem determination. However, if you do want to extract more information about the abend, you can ask for a reanalysis of the fault, using the ISPF interface to initiate batch or interactive reanalysis.