Starting the topology discovery process
Starting the topology discovery process involves selecting the observation points to be used and exercising the system under test. You can add the discovered resources to your model of the system under test.
About this task
You must select at least one observation point to begin the discovery process. You can choose observation points from the Registered Intercepts table, from the Configurable table, or both.
- CICS® DPL
- CICS® TG
- HTTP
- Java agent
- JDBC
- SIB
- TCP
Most of the observation points are named after the types of resources they can observe. For example, use the HTTP observation point to observe the HTTP traffic. The exceptions are TCP and the Java agent.
- TCP
- IPIC (protocol for communication between IBM® TXSeries® for Multiplatforms and mainframes that use TCP/IP)
- IMS™
- MQTT
- FIX
- Kafka (A messaging framework that uses a binary protocol over TCP.)
- HTTP observations when an application makes HTTP requests by using either the standard JSE API or the Apache HTTP client APIs (version 3 or 4).
- JMS observations when an application makes JMS requests by using the standard JMS API.Note: The new JMS 2.0 APIs are not supported for discovery, recording, or stubbing.
You can capture credentials when you observe JMS requests. To enable this feature, you must set
the capture property to on in the
registration.xml file for the Java agent. When you subsequently model resources
based on these observations, identities are created based on the captured data, and the most
commonly used identity is associated with the generated transport.
Procedure
- In the Architecture School perspective, select the Topology Discovery view.
-
Click the Registered Intercepts tab, if it is not already open in the
Observation Points pane, and select one or more observation points from the
list of available
Rational® Test Control
Panel
intercepts by clicking the box under the Observe column.
The Registered Intercepts table displays the types of intercepts that support observations. For each intercept type, the number of currently registered intercepts is also displayed. Rational® Test Control Panel must be running at the time you use the intercept observation points.
You can click Refresh to update this information. You do not need to provide any additional configuration information to use these observation points.
- Optionally, to select an observation point for WebSphere® MQ, click the Configurable tab.
-
Click the Start discovery icon
 .
.
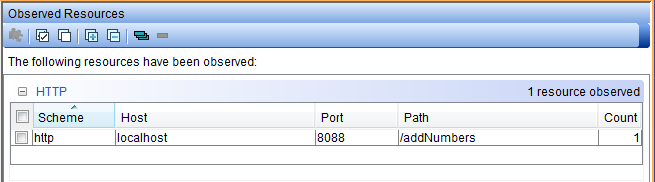
- Exercise the system under test.Topology discovery is similar to using the recording studio where you are observing processes in action. As the specified observation points observe resources, those resources are displayed in the Observed Resources pane. The resources are grouped by observation point. If a model of a resource already exists on your system, the line for that resource is highlighted in orange. This color can be changed in the project preferences. Right-click the line for the option to open the modeled resource within the project.
-
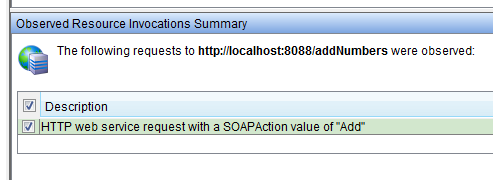
Click a discovered resource for more information.
A summary of the invocations of the resource is displayed in the Observed Resource Invocations Summary pane.
-
To stop the discovery process, click the Stop discovery icon
 .
.
Although you can model observed resources while the discovery process is running, stopping the process can free up resources and reduce the amount of work that is performed by the observation points within the system under test.
Restriction: If you are modelling a system by using the resources discovered for the Kafka transport, you must manually select only the rows that show the details under the Connection properties column.