Log Measurement action (optional)
With the Log Measurement action, you can periodically record custom data, that is, data that is not provided by test engines and probes, as a performance test runs. The recorded data is stored in a database and is used to generate performance charts. Each item of data that is recorded is called a counter. Attributes are used to identify the counters. A UTC time stamp is stored with each set of counters.
This action is useful in several cases. First, you can use it to record data from the system under test, acting as a custom probe. A custom probe might be necessary when information is required that is not covered by the Rational® Integration Tester probes; for example, when querying proprietary systems for information.
Another use is for systems where a message goes through several processes before a response is received by Rational® Integration Tester. In these cases, you might want to measure the time that is taken for a single process to provide a response instead of measuring the entire round-trip time between the initial message that is sent from Rational® Integration Tester and that eventual response.
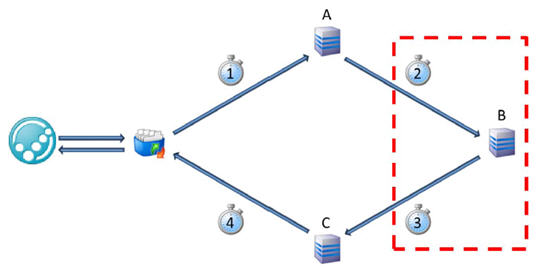
This example shows Rational® Integration Tester publishing a message to a queue and waiting for a response. Using the data that is normally gathered by a performance test, you can see how long it takes for the message to be processed by services A, B, and C. However, if there are performance issues as you increase the load on the system, you do not know whether these issues can be narrowed down to a single service.

For example, you might suspect that service B is where most of the delay is occurring. To investigate further, you can add time stamps to fields in the message as it passes through the system. Subtracting Time 2 from Time 3 gives you the amount of time that was spent inside service B. Using the Log Measurement action, this information is recorded in the results database, and you can analyze it with the load on the system.