Events view
The Events View displays events that are captured by enabled event monitors. The perspective at the right of Recording Studio is divided into two views: a list of captured events on top and details for the selected event at the bottom. Within the view, you can send a response to selected events or run and manage triggers.
The events table displays the captured events and includes the event sequence ID, the event type, the time when the event was captured, the source of the event, and the event description. The event sequence ID indicates the order in which the selected event was captured during this Rational® Integration Tester session, relative to other events. Captured events can be saved as tests, stubs, triggers, requirements, operations, and test data sets. Within the view, you can send a response to selected events or run and manage triggers.
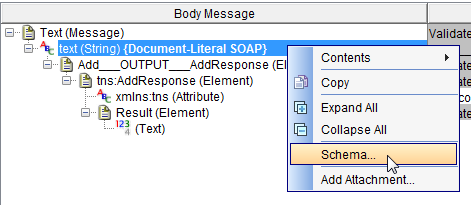
- For message-based events, the message body and header contents
are displayed. To apply a new schema to a message-based event, right-click
the root node and click Schema.

In the Schema Selector window, select a category, type, schema, and root. The schema need not be a Rational® Integration Tester schema, or a schema that is already available in the Schema Library. For more information, see Applying schemas and formats to messages.
- For SQL events,
OverviewandResult Settabs are displayed, depending on the type of SQL statement.
The following table lists the details that are displayed for SQL statements.
| SQL statement | Details displayed |
|---|---|
| INSERT, UPDATE or DELETE |
|
| SELECT |
|
| CALL |
Note: If an Input
parameter and Output parameter have the same index, it indicates that
the parameter is an Input/Output parameter.
|